Exam 1 example
Short answer
- According to the idea of the “Grammar of Graphics,” what is a statistical graphic?
- What is the main difference between a barplot and a histogram?
- What is overplotting? Name two ways to deal with it.
Graphics
One of your employees shows you this graph about the number of books in Utah’s 71 libraries.
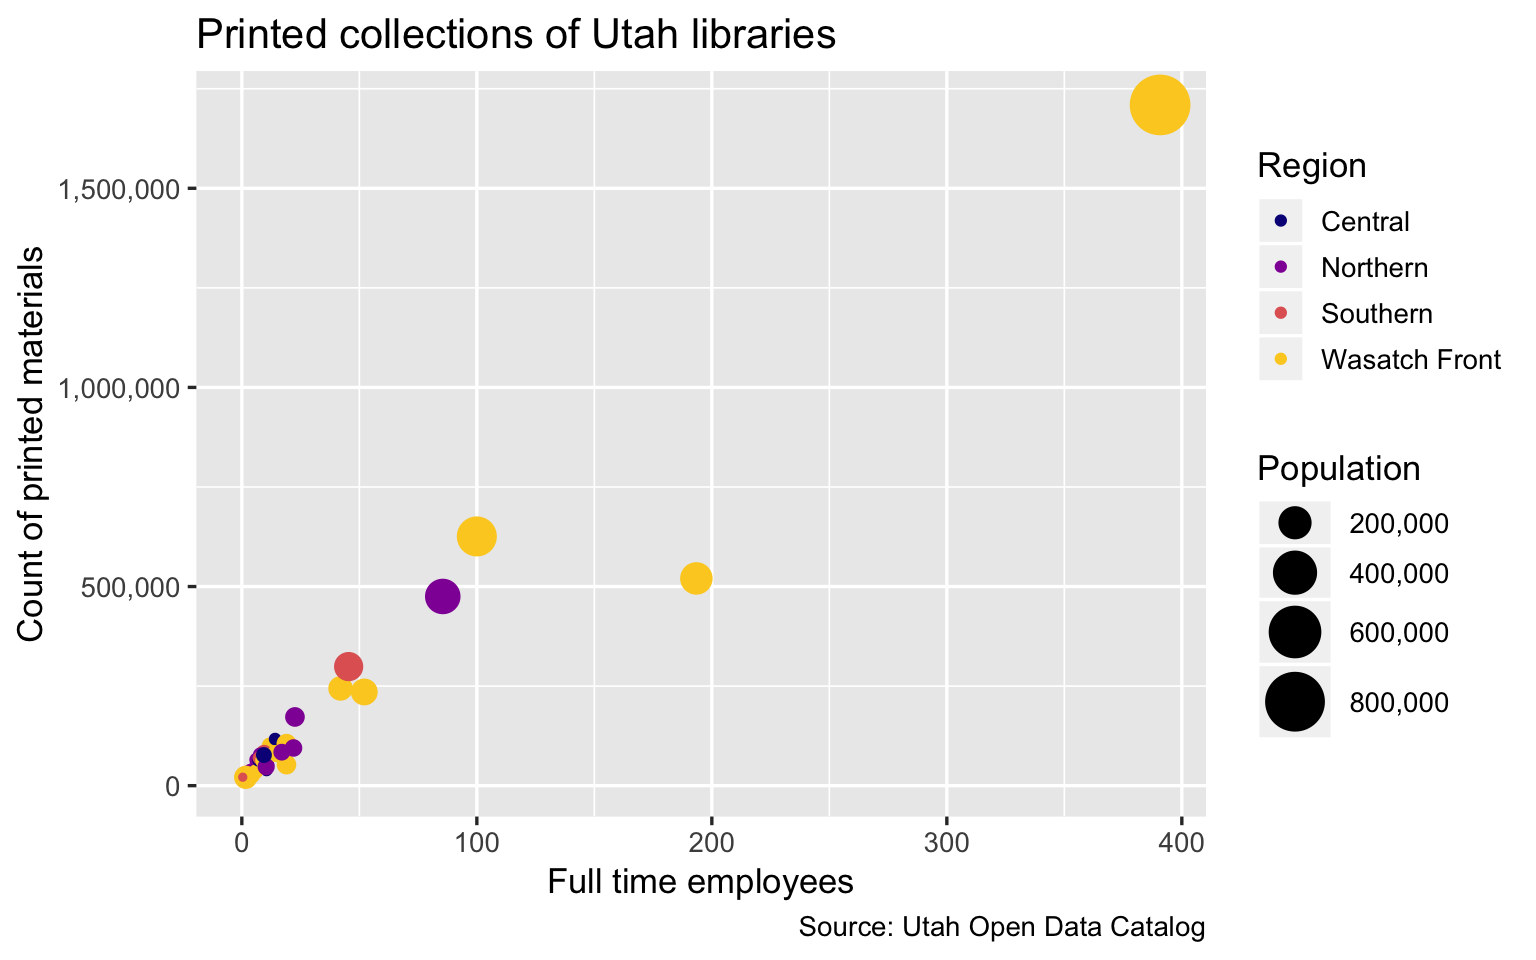
- Identify:
- All of the variables displayed in this graphic
- How they are represented in the graphic (hint: think of which
aesandgeom_*applies to each variable)
- What is the main comparison being made in this plot?
- How could this plot be improved?
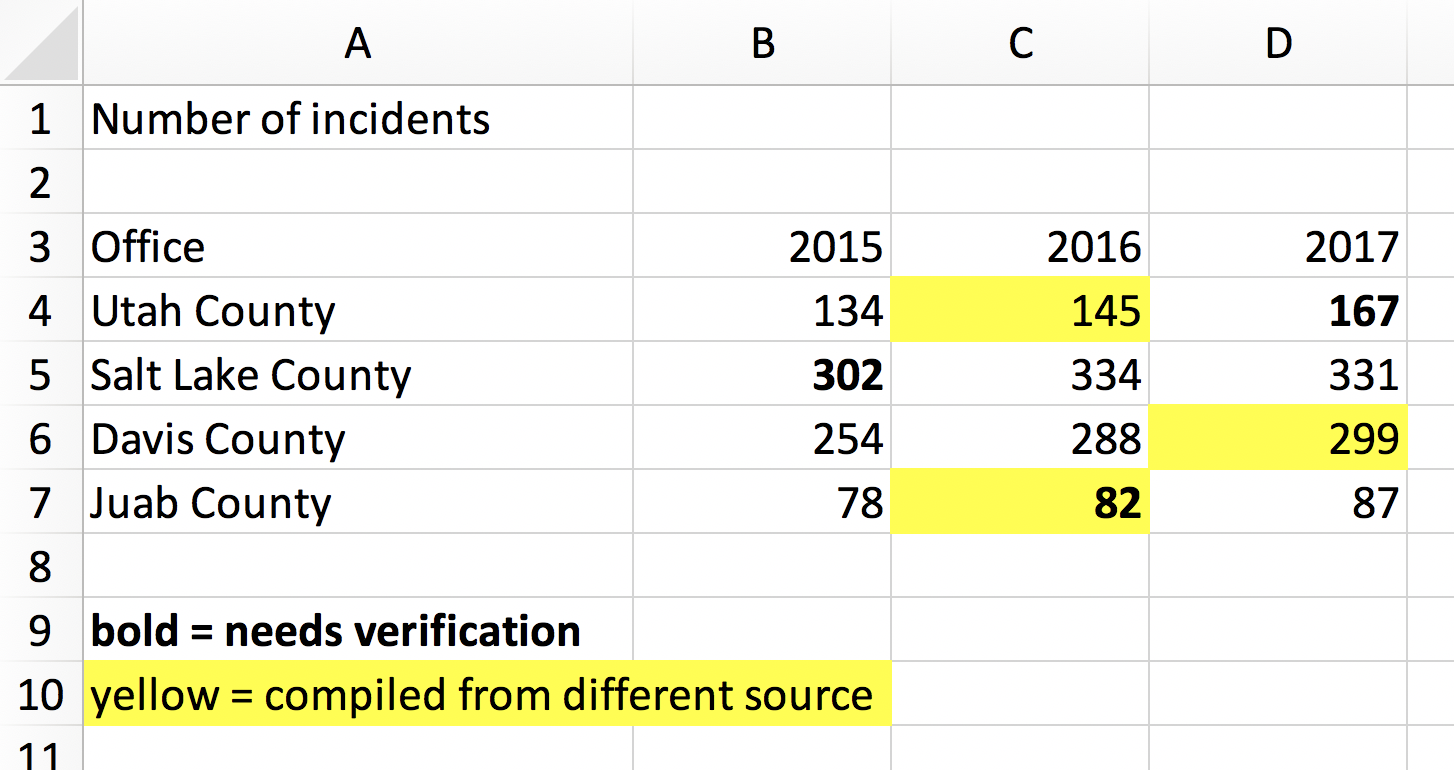
Tidy data
You just received this spreadsheet from one of your interns and you want to manipulate and graph it with R. This data is not in a tidy format. Rewrite this data frame so that it is tidy (by hand; no code is involved).