Problem set 4
Due by 11:59 PM on Thursday, November 1, 2018
SAT scores have long been a major factor in college admissions, under the assumption that students with higher test scores will perform better in college and receive a higher GPA. The SAT’s popularity has dropped in recent years, though, and this summer, the University of Chicago announced that it would stop requiring SAT scores for all prospective undergraduates.
Educational Testing Service (ETS), the creator of the SAT, collected SAT scores, high school GPAs, and freshman-year-college GPAs for 1,000 students at an unnamed university.This is real data about real students, compiled and cleaned by a professor at Dartmouth.
You are a university admissions officer and you are curious if SAT scores really do predict college performance. You’re also interested in other factors that could influence student performance.
The data contains 6 variables:
sex: The sex of the student (male or female; female is the base case)sat_verbal: The student’s percentile score in the verbal section of the SATsat_math: The student’s percentile score in the math section of the SATsat_total:sat_verbal+sat_mathgpa_hs: The student’s GPA in high school at graduationgpa_fy: The student’s GPA at the end of their freshman year
Instructions
Setting up your project
You can copy the “Problem Set 4” project on RStudio.cloud, which has this set up for you. But remember that you should eventually be moving off the cloud version and onto your computer, and this might be a good assignment to make that transition. Here are the instructions for installing everything on your computer.
Create a new RStudio project named “problem-set-4” (or whatever you want to call it) and put it somewhere on your computer.
Navigate to that new project folder on your computer with File Explorer (in Windows) or Finder (in macOS) (i.e. however you look at files on your computer).
Download this R Markdown fileYou’ll probably need to right click on the link and select “Save link as…”
and place it in your newly-created project (but not in your data folder—put it in the main directory):Create a new folder in your problem set folder called “data”.
Download this CSV file. It’ll probably go into your Downloads folder.You’ll probably need to right click on the link and select “Save link as…” or something similar—often browsers will load the CSV file like a web page, which isn’t helpful.
Using Windows File Explorer or macOS Finder, move the newly downloaded CSV file into the “data” folder you created.
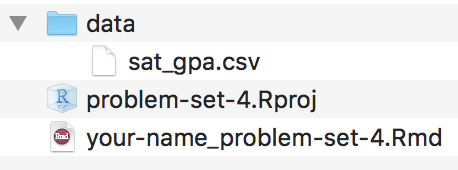
In the end, your project folder should be structured like this:Make sure your .Rmd file is not inside the data folder.
Completing the assignment
Ensure that you have your new
problem-set-4project open in RStudio. Open the.Rmdfile from the “Files” panel in RStudio and follow the instructions there for the rest of the problem set.You’ll be answering the following questions. These are already in the problem set template and there are empty code chunks for you to use when answering.
- How well do SAT scores correlate with freshman GPA?
- How well does high school GPA correlate with freshman GPA?
- Is the correlation between SAT scores and freshman GPA stronger for men or for women?
- Is the correlation between high school GPA and freshman GPA stronger for men or for women?
- Are there any sex-based differences in SAT scores? Are sex-based score differences larger in the verbal test or the math test?
- Do SAT scores predict (or explain variation in) freshman GPAs? If so, how much college GPA change is associated with changes in SAT scores? (i.e. interpret the slope for the SAT coefficient) How much of the variation in college GPA is explained by this model?
- Does a certain type of SAT score have a larger effect on freshman GPAs?
- Do high school GPAs predict (or explain variation in) freshman GPAs? If so, how much? How much of the variation in college GPA is explained by this model?
- Does the effect of SAT scores on college GPA change when controlling for gender? What is the effect of SAT scores in this model? What is the effect of gender in this model? How much of the variation in college GPA is explained by this model?
- Does the effect of SAT scores on college GPA change when controlling for both high school GPA and gender? What is the effect of SAT scores in this model? What is the ffect of high school GPA in this model? What is the ffect of gender in this model? How much of the variation in college GPA is explained by this model?
- Which model best predicts freshman GPA? How do you know?
- Do women’s SAT scores underpredict their freshman GPAs?
- Should SAT scores be used for college admissions?
- What else might statistically predict freshman GPA? What else should be taken into account when admitting students?
Knit the
.Rmdas a Word documentOr PDF if you’ve installed tinytex.
when you’re done and submit it via Learning Suite.